This case study includes specific examples and metrics for Lean and IPD.

Creating a Validation Study
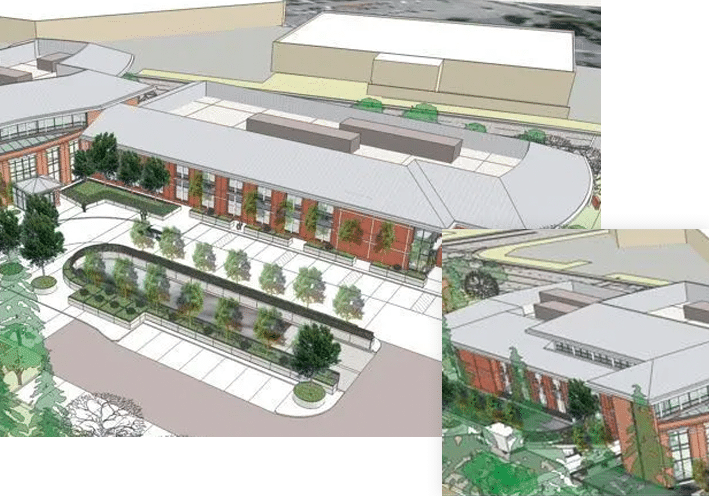
In order to put a validation study together, the owner did an RFP for a lead design firm and a lead general contractor.
Once these teams are selected, the owner, design and general contractor will select the remaining design and construction partners. The owner will pay the newly formed team for a period of 2 - 4 months to develop a study of the proposed project.
The team for the Medical Office Building produced the validation study at about a 95% CD level with many of the most common interior rooms at a 50% DD level.
The report consists of roughly 200 pages and includes the following information:
-
Diagnostic Imaging
-
Pediatrics
-
Family Medicine
-
Internal Medicine
-
OB/GYN
-
Laboratory
-
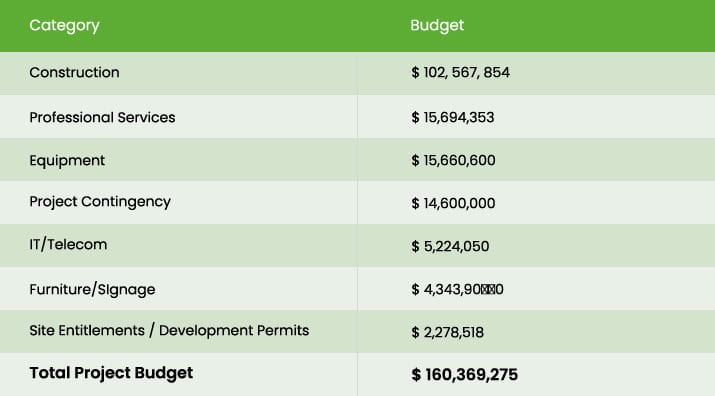
600 Parking Spaces
Coordination During Design
Creating an Aligned IPD Contract
Once the Validation phase is complete and the project is funded by the Board of Directors, the project moves into the delivery phase.
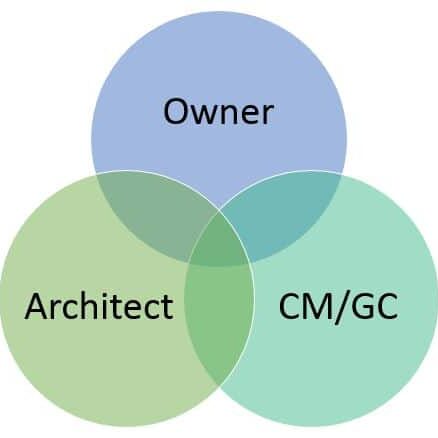
The owner, architect and general contractor sign a single contract for design and construction. This is different from traditional design - bid - build or CM at-risk where the owner typically signs one contract with the architect and a separate contract with the CM/GC (General Contractor).
Some multiparty contracts have more than 3 signatories, one Sutter contract had 11. This project used a more standard three party agreement and brought other at-risk parties onto the project through joining agreements coupled with customized subcontracts under the architect or CM/GC.
The Contract Value
The contract value is set at the Estimated Maximum Price or EMP. The EMP is the sum of the design costs, construction costs, and a negotiated team contingency.
The team agrees to put 100% of their profit at risk if the estimate and contingency are exceeded. In exchange, the owner will pay the cost of the work regardless of its final amount (this would mean the team makes no profit).
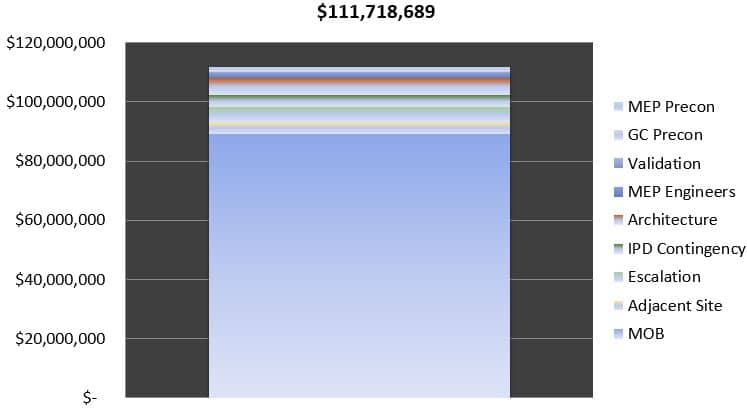
The Sunnyvale EMP was $111,718,689. This amount included all validation costs, preconstruction, design, construction, escalation and a contingency of roughly 4% that was set near the completion of Design Development.
Governance Structure
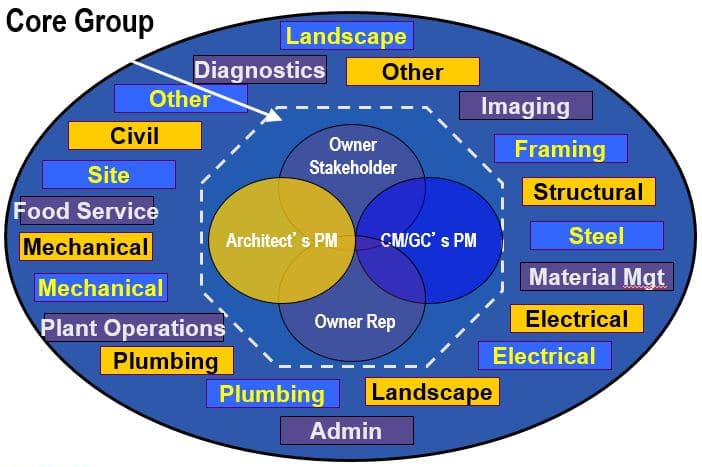
The project governance structure is centered around a Core Group, composed of decision making representatives from the Owner, Architect and CM/GC:
Owner's Representative (Owner's Project Manager)
- Owner Stakeholder (operational lead for the specific clinic)
- 3 Representatives from the Architect (Project Executive, Lead for the Exterior and Lead for the Interior)
- 2 Representatives from the CM / GC (Lead Project Manager and Lead Superintendent
All decisions are expected to be made at the Core Group level. In the case of an impasse, there is a Senior Executive Team (SET) that sits above the Core Group with a representative from the Owner, Owner Stake Holder, Architect and CM/GC. On this project, only minor issue was elevated to the SET over 30 months.
Risk/Reward Partners
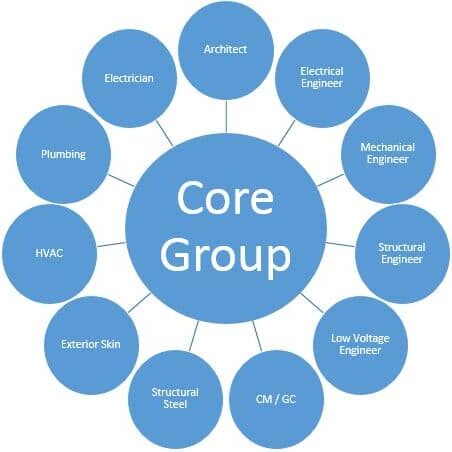
The project brought 11 teams into the Risk/Reward Pool. To become a risk/reward partner, the company agrees to fix their profit as a lump sum amount at the time of the EMP and put 100% of that profit at risk.
The risk/reward partner's Overhead and Labor Rates are audited by an accounting firm to get them as close to actual cost as possible.
The Owner agrees to pay each of these risk/reward partners their cost of work plus overhead on the project even if they go over budget.
The profit for the team is saved if the entire risk/reward team (and all lump sum trades) do not go over the budget. If one party goes over budget, but the rest of the team makes up the difference with savings, then all team members will get their profit.
If the team goes over the cost of work and contingency budget, then the next round of cost overruns are paid for by reducing the collective profit of the team. Cost overruns effect all risk/reward partners regardless of fault.
Structure of a Risk/Reward Pool
The risk / reward pool is created by combining the lump sum profit amounts of the 11 companies that agree to become at risk parties.
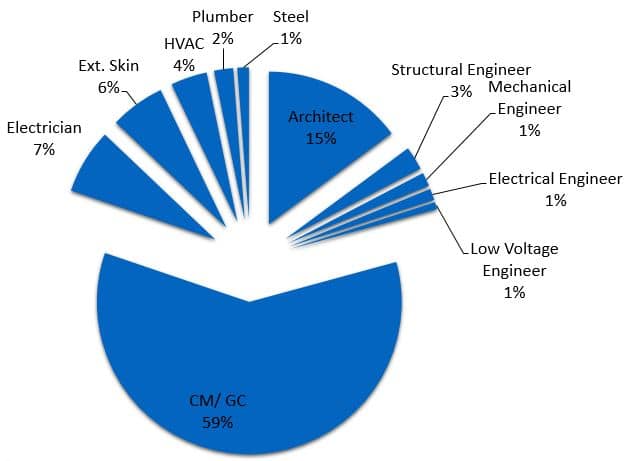
Their profit is added up to form the risk / reward pool. For this project, the pool was about $4.4Million. Each parties risk / reward share is calculated by their lump sum amount of profit in the pool divided by the total amount of the pool.
example: The General Contractor put $2.6Million into the pool of $4.4Million, so their percentage of the share is 59%. For every dollar of profit that is used to cover an overage on this project, the CM/GC covers $.59. For every dollar of reward created, the CM/GC gets $.59 of it.
Risk/Reward Plan
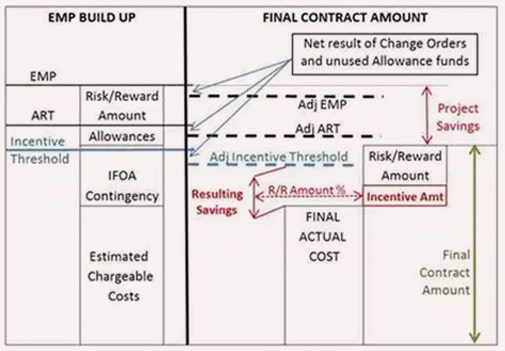
Once the EMP is built and the Risk / Reward amount (total profit) is established, the incentive program is negotiated.
-
At Risk Threshold
This is the EMP minus the Risk / Reward amount (Cost plus contingency and any allowances).
-
Contingency Percentage
The percentage of cost of work that is added above the cost of work estimate to buffer the team from losing profit when costs exceed their original estimate.
-
Incentive Threshold
This is an amount that is negotiated. Below the incentive threshold, the team participates in shared savings.
-
Shared Savings Percentage
This is the amount of any shared savings that goes to the IPD team. The rest goes to the owner.
-
Project Specific Plan
The EMP for this project included $4.2 Million in contingency (about 4%). The EMP was set early for the team so the Incentive Threshold was set at the At Risk Threshold, meaning the team would share in savings of any unused contingency. The Shared Savings was set at 35% to the team with no cap, meaning the team would receive 35% of any savings below the Incentive Threshold (which is then split to each company by the Risk/Reward share calculated above).
Co - Location for Success
The project set up a collocation site (Big Room) after the project was funded by the Board of Directors at the end of the validation stage.
The Big Room was composed of 6 trailers located in the parking lot at the project site. The CM/GC, Owner and Trade Partners (at risk sub contractors) worked full time out of this space.
The architect's office was 5 miles from the site so they did not work full time out of the Big Room, but they were there on a daily basis. The design engineers would come to the site for specifically planned cluster meetings and for design coordination.
The Big Room was used as the office for the staff, for the MEP modelers to work and collaborate, for all pull planning and weekly work planning, as well as meetings with users and the project team.

Target Value Design
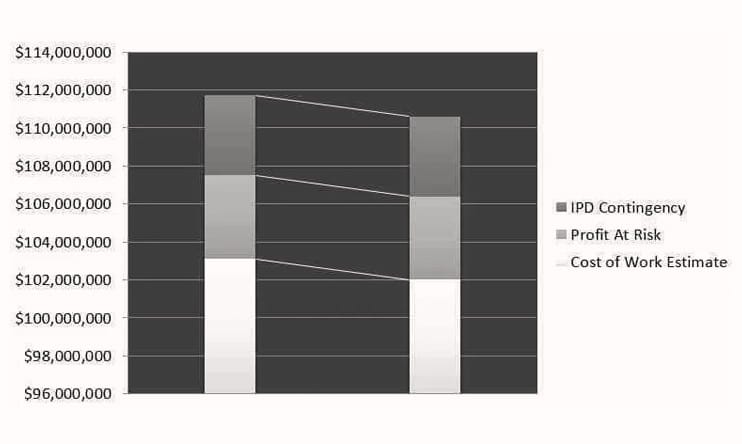
Target Value Design:
Maintain or increase the originally proposed program, schedule, quality and budget throughout design and delivery of the project by constantly monitoring cost as an input to design throughout the evolution of the project.
The project had a goal of driving down the cost on the project by $3.4M while maintaining all of the components of the Board approved Validation Study.
The project's shared savings plan allowed the team to maintain their original lump sum profit as the estimated cost of the project was driven down as well as share in the realized savings. This effectively works to increase the margins of all risk-reward partners by keeping the lump sum profit on a smaller amount of delivered work as well as increasing the amount of the lump sum profit with the shared savings.
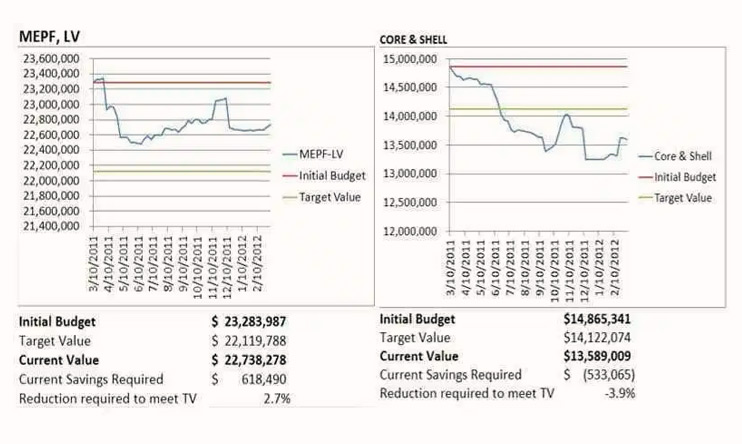
Each Cluster would track each item that was under review by the team. Every week that the cluster's didn't meet, the Cluster Champions for each cluster would meet and present on their current status.
These regular meetings allowed the teams to make sure that all ideas proposed where in the best interest of the overall project and not just the individual cluster, ie not just moving cost from the substructure cluster into the core and shell cluster.
Each cluster's data rolled up into a cost tracking graph against plotted against the original cluster value and the target value for that cluster. Some cluster's beat their targets and other did not beat their target. Every cluster was able to drive down the cost below their original value.
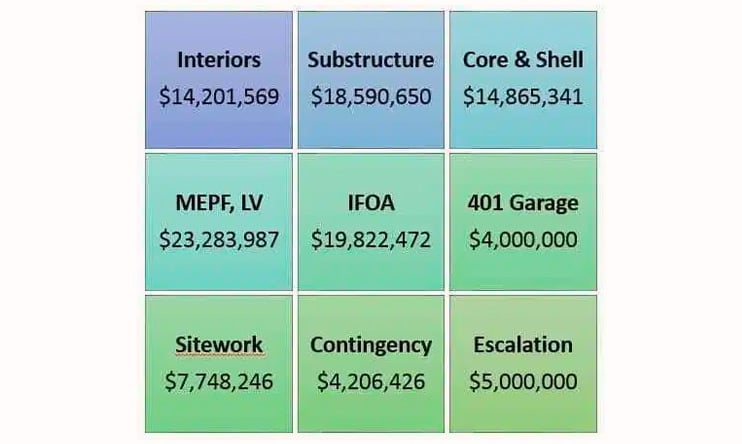
Cluster Groups:
A group of companies with related scope grouped together based on their budgets and tasked to drive down overall cost while maintaining scope.
Cluster groups are encouraged to consider tradeoffs of scope between firms and finding innovative ways of delivering the work to increase the overall value.
The design and construction budget was divided up into 9 clusters of interrelated scope. Each cluster held biweekly meetings with a designated champion and a standard form for meeting minutes and cost tracking.
The cluster groups generated hundreds of ideas to lower the cost of the project.
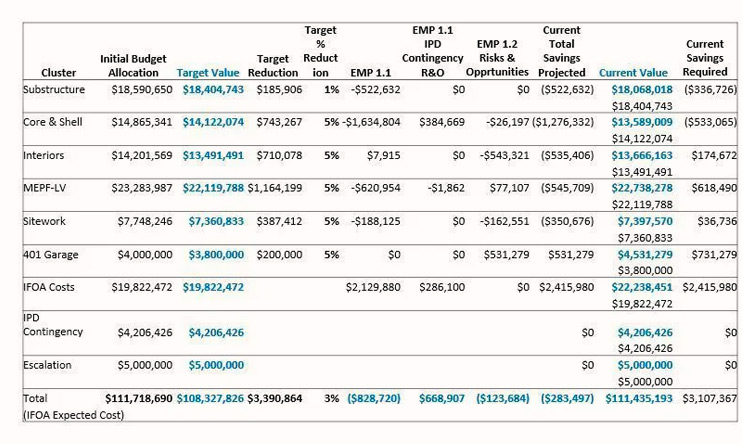
The summary of each cluster's status was rolled into an overall tracking template for the progress against the validation estimate and the $3.4M target.
The Sunnyvale project broke the contractual Estimated Maximum Price (EMP) into two parts: 1.1 - locked in the design costs, profit for the project, contingency for the project, escalation for the project, and the costs of construction through the core and shell. 1.2 - locked in the tenant improvement cost and the parking garage on an adjacent site.
Based on this experience, it is not advised to break a project into two EMP components.
Last Planner System
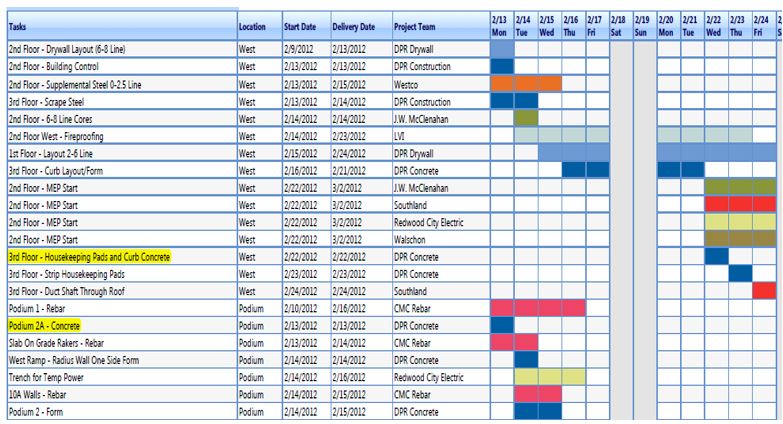
Weekly Work Planning: Primarily used during construction activities, foremen met weekly (on Thursdays) to plan the work for the following week. The meetings were facilitated by the superintendent for the general contractor, but the actual commitments and discussion came from the foremen.
Weekly work plan were captured on large white boards in the project's big room trailer at the site. The commitments were well defined and tracked by area and company.
Once the team agreed on the plan, weekly activities were captured in a proprietary software system created by the general contractor which was purchased by Autodesk and reintroduced as part of BIM360 Plan. The plan was then issued electronically to the field teams as well as posted in different areas of the site.
Planned Percent Complete (PPC): Tracking of whether or not a specific commitment was met in a workflow with a yes/no answer and is a component of the Last Planner System (R) of the Lean Construction Institute.
Each weekly work planning meeting started with a review of the plan for that week (made the previous week). Each task was either completed or not completed (no partial completion was allowed).
The software system was able to track the reliability of the work plans as reported by PPC. The PPC was tracked by company on this project. Overall, the project completed with a PPC just over 82%.
The team did not report out on variances for the project and word do so on future projects. There was a loss of ability to make corrections for incomplete commitments due to the lack of variance tacking (i.e. why did an activity not finish as planned).
Cost Forecasting
Projected Cost to Complete: In IPD projects where the owner is tacking the risk of overall budget overrun, it becomes more important for the owner to engage the team in detailed forecasting.
In order to better forecast cost to complete on a construction project, the team needs to have a detailed understanding of how the cost estimate was developed. Then the team must implement a system to track actual hours and material against the estimated amounts. The actualized productivity can be forecast across the remaining work to establish a reliable cost to complete for each major trade.
Each company or trade can establish their own method for tracking work put in place against their estimate as long as the team agrees that the method is sound.
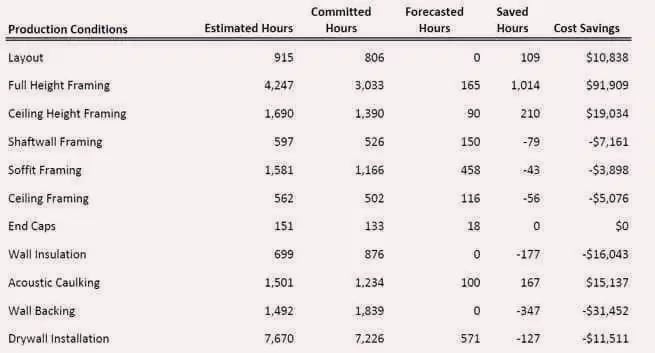
The drywall trade on this project tracked hours by scope and then applied an average hourly cost to those hours to convert the projection into a projected cost to complete.
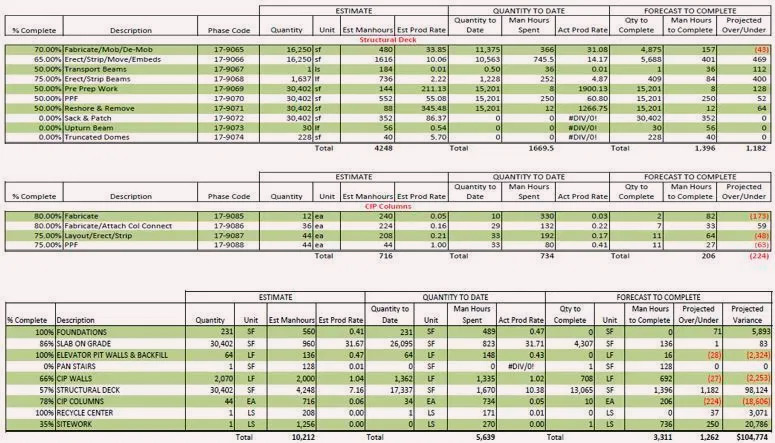
Concrete productivity was tracked by looking at cubic yards of concrete placed and the hours that it took to place those yards. a cubic yard / hour metric was developed and then used across the remaining cubic yards for each scope.
The team was able to quickly assess (around 25% complete for each scope) whether the work in that area would run over or under budget. The most valuable reason for tracking this early was that the team could opening discuss with the other trade where they were ahead and where they were falling behind. The team was able to make adjustments to the plan in order to minimize any overruns early in the process.
In an IPD environment with guaranteed cost, shared savings, and a collective outcome, tracking the design team spending and productivity is just as important as tracking construction productivity.
Design team productivity projections are set up by starting with detailed Resource Loaded Work Plans (RLWPs) for each of the At-Risk design partners.
This usually includes at least the Architect, Mechanical/Plumbing, and Electric Engineers and in many cases may also include Structural, Civil, Landscaping or other designer based on the size and complexity of the scope for the specific project.
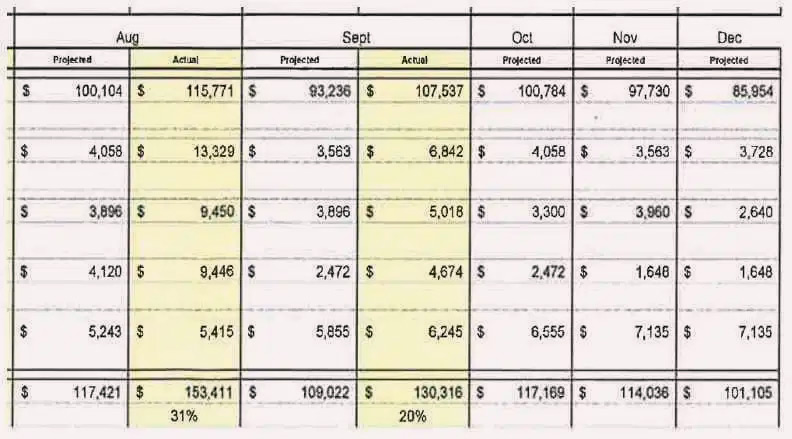
What is a Resource Loaded Work Plan (RLWP)? A RLWP is a monthly allocation of all people to be employed in the design of a project broken down by the number of hours they will spend on specific tasks (might be Schematic Design, Design Development, etc or it might be Mechanical Duct Design, Controls Design, Plumbing System Design, etc or some other breakdown that makes sense for the project team. This break down of hours can be multiplied by hourly rates to come up with the proposed value of the work effort by person, by specific task, by month, year or for the total project.
Starting with a well developed RLWP that is consist with the team's plan for delivering the project is the most important part of completing the design on budget (having the right budget).
Once a RLWP is approved, each team tracks their monthly hourly spend against the work that they complete each month. This monthly burn rate (total hours x hourly rates) is compared against the expected spend in that month. The team collaboratively reviews the update each month and looks at the variance between actual and planned.
If the team is tracking over budget, is it because the design team is ahead and getting things done faster, or is it because they don't have all the information they need and are spinning their wheels.
Understanding the root causes of the variances early and with the ability to react is the main purpose of this tracking. Once root causes are developed, the team is engaged and empowered to make the necessary changes.
Cost Forecasting
Risk and Opportunity Log:
All changes and conditions that have an impact on the original budget, either increases or decreases, are tracked on a single log. Items are identified as either IPD changes (meaning no change to the EMP value) or Owner Changes (meaning and increase or decrease to the EMP).
View example of change management for an opportunity.
View example of change management for a risk.
Owner changes are limitted to discovered site conditions, Agency changes, and Scope Changes (directed by the Owner).
The sum of these items is reported out to the team no less than monthly and there is discussion about how to limit increases and find more decreases to the budget while maintaining the base scope.
Owner directed scope changes on an IPD project go through a thorough vetting and approval process. Changes can only be approved by a senior executive of the business. This eliminates frequent changes to the team. Only changes with a clear business case are made which have an ROI based on the added cost and schedule risk to the project.
Outcomes and Results
This project completed 10 weeks ahead of the original contract schedule for construction and opened for business 3 months ahead of the original target date.
The final cost was below the original EMP, even when accounting for added scope. A bonus of $585,000 was paid out to the consolidated IPD at risk parties, which was split based on their pro rata share of the pool.
100% of the $14M owner contingency was returned and deployed to fund additional capital projects.
